
Try a Climate-Data report, free
See how a report looks and works, using a real greenhouse location. Look around in the preview right now, or leave your email address for the full interactive demo.
Preview or full demo?
Preview
Open now, no email needed
- Project and location information
- Three charts: temperature, solar radiation and DLI
- Language: English, Dutch and German
Full demo
Free, with your email address
- All 17 charts and the climate and light guidelines
- Zoom in by year, quarter and month
- Metric and imperial units, extremes and averages
- Choose your own reference crop
- More demo locations
Get the full demo
Leave your email address. You get a sign-in link by email, no password needed. After you click it, you land in the client portal with the demo reports ready to open.
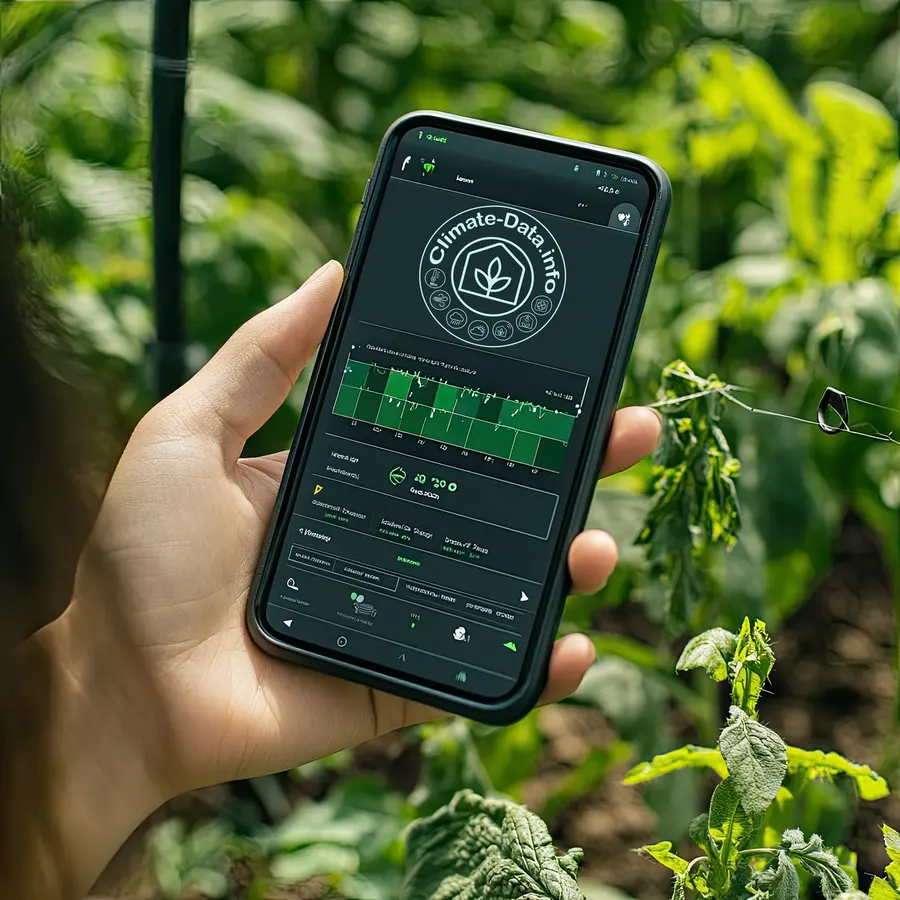
How it works
Leave your email address
Fill in the form on this page or in the preview.
Click the link in your email
This confirms your address. You do not need a password.
Open the demo
You land in the client portal. Choose a location and open the report.
Good to know
Is the demo location real?
The project and its exact GPS location are fictional. The climate data behind the charts is real historical data for that area, so you see exactly what a report for your own location would show.
What do you do with my email address?
I use it to give you access to the demo. How I handle your data is explained in the privacy statement.
Can I get a report for my own location?
Yes. A Basic report costs €175 and an Advanced report €381, excl. VAT. Your report is online within 24 hours after I receive your payment.